Owen Cotton-Barratt
Areas of endeavour
This is part of a series of posts on how we should prioritise research and similar activities. In a previous post, we investigated methodology for estimating the expected returns from working on a problem of unknown difficulty. We argued that ex ante the expected benefits should often scale approximately logarithmically with the resources invested.
In this post we turn our attention to the case where rather than a single problem, there is a wide range of problems in a single area. The paradigmatic example is a research field, but we could also think of more diverse areas such as lobbying for a range of related policy changes, or producing successive innovative improvements in an industry. The individual problems in the area should be of a one-off nature, and not too similar to one another.
This post explores some theoretical justifications for the following claim:
Law of logarithmic returns
In areas of endeavour with many disparate problems, the returns in that area will tend to vary logarithmically with the resources invested (over a reasonable range).
More precisely, we will argue that under some assumptions about the distribution of problems in the area, we can expect to find approximately logarithmic returns to resources ex post as well as ex ante. This post will be concerned with the theoretical justifications for this claim; in a companion post we explore how its predictions match up with real-world data and look to consequences.
Assumptions
Assume that we have an area containing several problems, each with its own benefit (the benefit that would be generated from solving it) and difficulty (the amount of work needed to solve it). Assume that the difficulties are distributed somewhat smoothly over several orders of magnitude, and that there is no significant correlation between the size of benefit and difficulty of a problem.
These assumptions seem reasonably representative of many real-world areas. It is sometimes (but not always) the case that it is the simplest breakthroughs which have the biggest benefits.
We will assume moreover that the distribution of benefits is not too heavy-tailed. This is to exclude the case where one discovery is much larger than the next biggest. That would mean that the returns around that discovery would be sharply discontinuous, which removes any chance for smooth ex post returns. If you think you may be in such a case it may be better to use the simple model for a single problem of unknown difficulty that we saw in the previous post. A hybrid model might be even better. Nonetheless in several areas the assumption that the benefits are not too heavy-tailed seems reasonable.
Given these assumptions, the distribution of problems might look something like the following diagram. Here the vectors represent the difficulty (horizontal axis) and benefit (vertical axis) of individual problems. Hence the gradient represents the ex post benefit-cost ratio for working on each problem.
Note: For the purposes of having an easy-to-read diagram, we don’t span too many orders of magnitude in the difficulty here. The benefits are also somewhat compressed, though not much would change to the qualitative picture if there were additional vectors with very small benefits spread evenly over the orders of magnitude of difficulty.
Types of problem selection
In order to model the returns from work in the area, we need to make assumptions not just about the distribution of problems, but also about the order in
which they are tackled. Here are three possible behaviours:
- Optimal problem selection: They are selected in order of decreasing benefit-cost ratio.
- Difficulty-based selection: The easiest problem is completed first, regardless of difficulty. Then work moves on to the next easiest.
- Naive problem selection: All problems are worked with equal resources in parallel.
If you knew beforehand everything about the difficulty and benefits of the problems, you would use optimal problem selection. If you nothing at all about the problems, you would want to use something like naive problem selection.
The reality will be somewhere in the middle. People know something in-between everything and nothing, so the efficiency of the strategy they pursue should be bounded between that of optimal problem selection and naive problem selection. We will analyse the outcomes under these two algorithms in order to understand these bounds.
Difficulty-based selection is an example of an algorithm somewhere in the middle. It is the one you would use if you knew how difficult each problem was, but not what the benefits were. We analyse it first as an easy-to-understand example.
Behaviour under difficulty-based selection
Under difficulty-based selection, the easiest problems are completed first, regardless of their benefits. By our assumptions, over several orders of magnitude of difficulty (the central productive range for the field), there are a similar number of problems of similar difficulty-level at each order of magnitude. Since there are a similar number, the cumulative difficulty of solving all problems at a given order of magnitude is roughly proportional to the difficulty of one such problem. And since there is no significant correlation between difficulty and size of benefit, the benefits from solving all of the problems at a given order of magnitude difficulty will be roughly constant regardless of the order of magnitude.
So, while we are in that central productive range, every doubling of total resources will produce approximately the same benefit. That is, there are logarithmic returns to resources in that region. Of course this is a large-scale average, but that can be appropriate when considering an entire field.
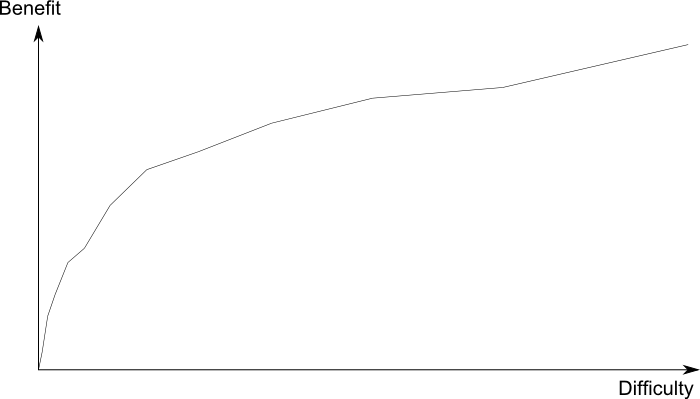
If we take the problems in the diagram above and solve them in order of difficulty, the ex post graph of returns with resources will look like this:
 Note that to fit in on the graph the horizontal axis has been rescaled. Although the order of solutions is not optimal, so the gradient is not strictly decreasing, the large-scale pattern is of approximately-logarithmically diminishing returns.
Behaviour under optimal problem selection
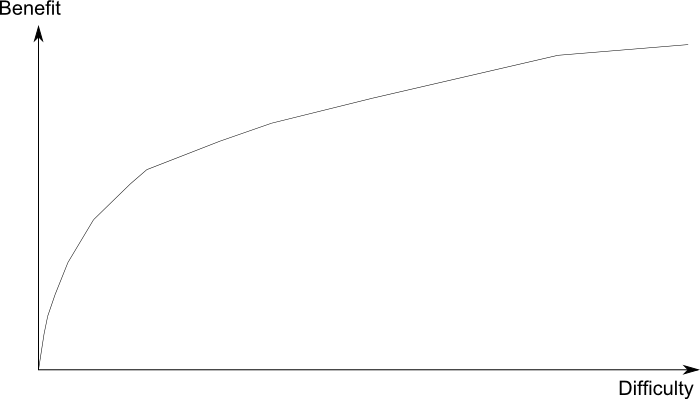
Consider the distribution of benefit-cost ratios for the different problems. If the difficulties range over several orders of magnitude, and benefits are independent, then the quotient of the two will be another distribution spanning several orders of magnitude. So long as the benefits are not too widely distributed compared to the costs, there will be a range for which the total benefits per order of magnitude are similar. Then we can apply the same argument as we had for difficulty-based selection that there will be a central range where there are approximately logarithmic returns. Note that the exact range where this applies may be different from the range where it applied under difficulty-based problem selection.
Here’s what the graph of returns under optimal problem selection looks like:
 Behaviour under naive problem selection
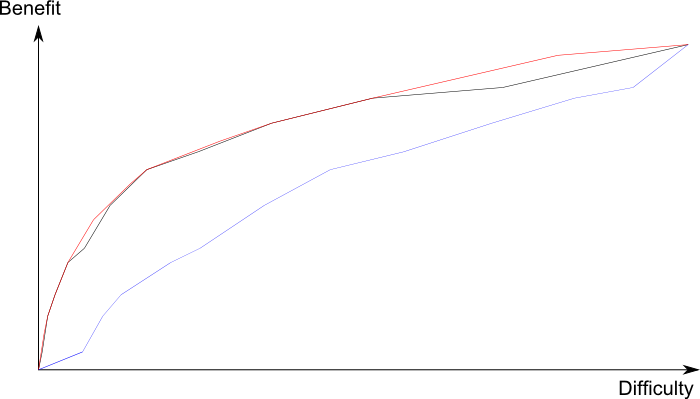
Under naive problem selection, the problems are all worked on in parallel, so the easiest will be solved first — i.e. the same order as under difficulty-based problem selection. The returns don’t diminish quite as steeply as in difficulty-based selection, though, as the following diagram shows (returns from optimal problem selection in red, difficulty-based problem selection in black, and naive problem selection in blue):
 There are two effects here:
First, we only track the marginal difficulty of a problem over the next easiest, rather than their absolute difficulty. If the problems are evenly distributed on a log scale, this doesn’t affect the relative difficulty to completion, after the first problem. It does make the answer slightly more sensitive to the degree to which the problems are not evenly distributed on a log scale.
Second, we are simultaneously working on all of the other problems. As more problems are solved, there are fewer others to work on. By the time of working on the final problem there is nothing else to use resources. This second effect distorts us further from logarithmic returns the more tightly clustered the problems are on a log scale, and the closer to the final problem we get.
Some examples to illustrate this (simple models I played with in a spreadsheet):
-
Assume that an area has 100 problems, the first of difficulty 1, and each of difficulty 1.05 times the previous one. Assume for simplicity that they all have equal benefits.
-
The most difficult problem has difficulty 125, and the total difficulty is 2,484
-
Logarithmic returns would suggest that when 1,000 resources have been invested the marginal rate of return would be around 1/5 of that when 200 resources have been invested.
-
Under naive problem selection, after 1,000 resources (and 58 problems solved) the marginal rate of return is only around ¼ of that when 200 resources have been invested (and 16 problems solved).
-
-
Same set-up as before, but now compare between the point of 1,000 resources invested and 2,000 resources invested (81 problems solved with naive problem selection)
-
Logarithmic returns suggest that returns should be ½ as good after 2,000 resources.
-
Under naive problem selection, the marginal value has only fallen off by a factor of about 1.4
-
-
Now suppose 200 problems, each again more difficult than the previous by a factor of 1.05, so that they spread more orders of magnitude.
-
Under naive problem selection, the decrease in marginal value between 1,000 resources invested and 2,000 resources invested is a factor of 1.9.
-
So there is a distortion towards returns which decay more slowly than logarithmically, albeit in many cases a small distortion. If we think that naive problem selection is a good model for real problem selection we may want to account for this.
I am a little sceptical, though: the factor which is driving the distortion is that as we solve more problems we have fewer left to solve, so our efforts are more concentrated. This seems to be more an artefact of the model than a description of real-world behaviour. While it might hold in specific circumstances — perhaps the classification of finite simple groups in mathematics — in general it often seems than when there has been more work in a field the number of questions being addressed increases rather than decreases. So I think that in many cases we need not worry about this distortion.
Other selection methods
Of course in the reality the selection methods won’t match any of these perfectly, but it is instructive to see that there is a similar behaviour even between what seem to be ideal and totally ignorant methods.
You could spend more time investigating this question more thoroughly, perhaps exploring other models and trying to tie it to real decisions by examining what information we have and how decisions are made.
One question I didn’t investigate above covers the case where we know the benefits of each problem, but not the difficulty. I conjecture that the best algorithm in that case is:
Benefit-based selection: All problems are worked on in parallel, with resources proportional to the their benefits.
For justification of this conjecture, see discussion in later posts on estimating the counterfactual benefits from working on problems of unknown difficulty. I didn’t see an easy way of doing analysis on it, although it could always be modelled numerically.
Conclusions
The purpose of this post was to show that, in an area of endeavour with problems of varying difficulty, a variety of plausible generating mechanisms produce approximately logarithmic returns to investment. We’ve demonstrated this from a theoretical perspective; in the companion post I go over some observed instances of this behaviour.
The assumption of logarithmic returns is simple, doesn’t need extra knowledge about how far through a field we are, and makes for analytically tractable models. These are all to its substantial merit, and I will use the assumption in domains when I want a fast answer or I don’t know how to answer these further questions.
As we saw in this post, though, the approximation can break down, particularly towards the beginning or end of a field. It would be great to have better models for the relationships in these domains, and good rules of thumb for when they’re appropriate. One way to learn more would be to produce synthetic data sets with a range of generating mechanisms, and analyse how good an approximation the law of logarithmic returns provides in different cases.
